In Part I of this series, we took a closer look at what GIS can do for facility managers.
If that one fell into your tl;dr category, here’s a quick summary: Any location data (trouble tickets, inventory slips, etc.) can be managed by a GIS. Information that would otherwise be filed away in the depths of your hard drive or file cabinet is all cleaned up into one easy to use system.
Here, we will use our own building as an example for how a GIS can work for facility management.
Our Building
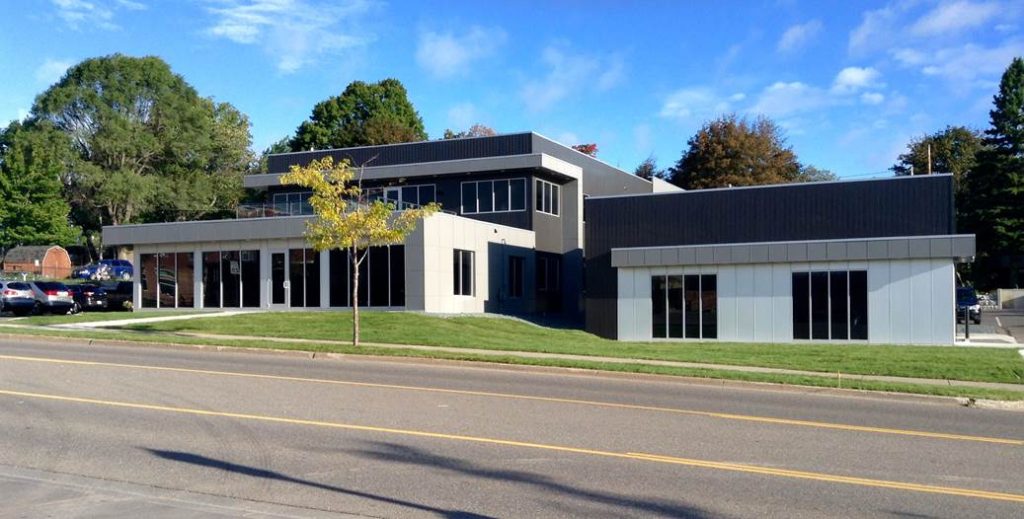
In 2015, we purchased a building for our new headquarters. Our CEO (let’s call him Tom) decided on a property on West Washington Street in downtown Marquette, a stretch now “up-and-coming.” The building was a bit of an eyesore. None of us knew exactly how we were going to pull off its transformation.
Over the course of a few months, we tore it down, built it up, and now stands a gem we are all very proud of (and us out-of-towners love to visit).
Before construction even started, the architect on the project provided detailed maps of the building and CAD drawings.
The carefully produced drawings always came in handy. Every time a contractor stopped by to ask Tom questions, he sifted through the collection of drawings until he found the necessary details. That’s when we realized this would be an excellent application for a GIS. It eliminated the need to refer to hard copies of the drawings and other documents during the construction phase. We also knew that down the road, it would organize and manage all of the data, documents, and attributes of the building.
TriMedia’s GIS
Our GIS contains information about all of our office locations. When zoomed out to view the Lower 48, a triangle represents each of our offices.
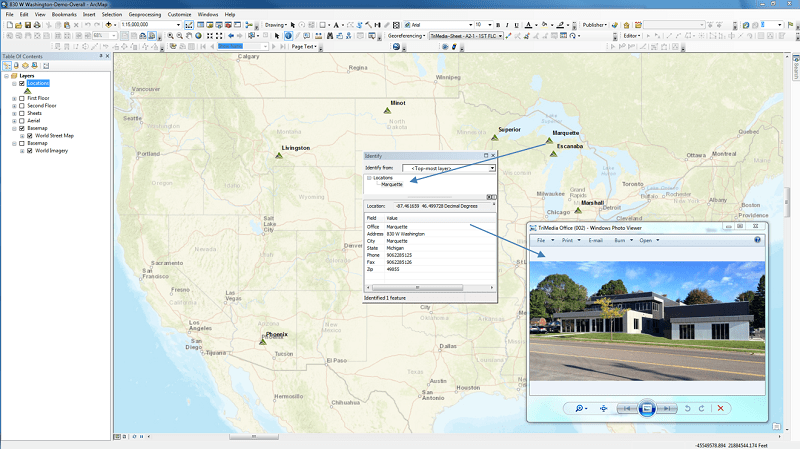
When one of the triangles is clicked basic information about the office pops up, including a photo of the exterior. While this overview of our locations is useful in some applications, the real magic happens at a more granular level.
Zooming into our Marquette location, an aerial photo comes into view. Our aerial photos are sourced from a web service, but if you have access to a drone, more updated and high resolution photos would be in their place. Another source for aerials is your local municipality.
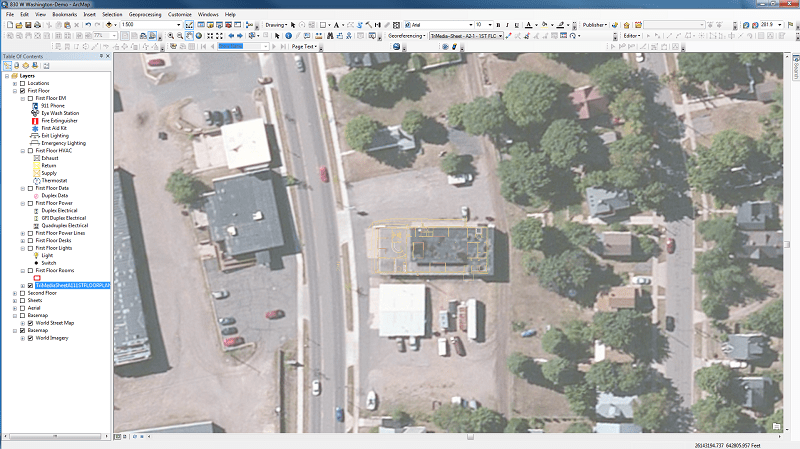
Zooming in even closer, an outline of the building appears. CAD drawings play well with GIS, providing the data for our office building outlines. If those hadn’t been available, we would have referenced blueprints to build the GIS.
[su_box title=”Worst Case” box_color=”#ee6800″ radius=”0″]If no drawings are available to work with, a GIS professional can make an outline of your building based on aerial photos. The interior is where it gets tricky, but for some applications, the basic outline is specific enough.[/su_box]
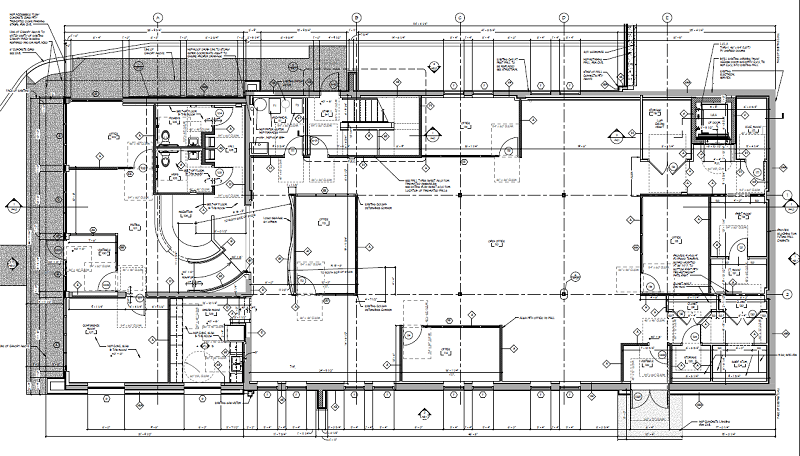
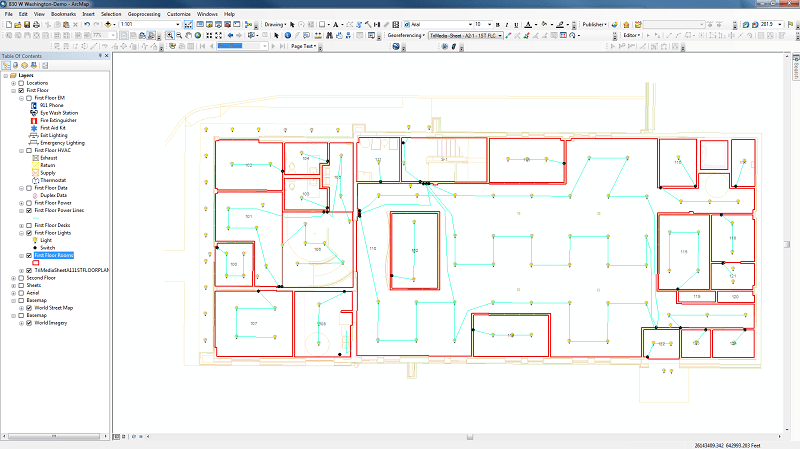
Using the CAD drawings, we mapped out the whole building, each floor, and each room.
[su_box title=”What if I have more than one building? ” box_color=”#638b18″ radius=”0″]On campuses with multiple buildings, each building can be individually mapped out with as much detail as needed.[/su_box]
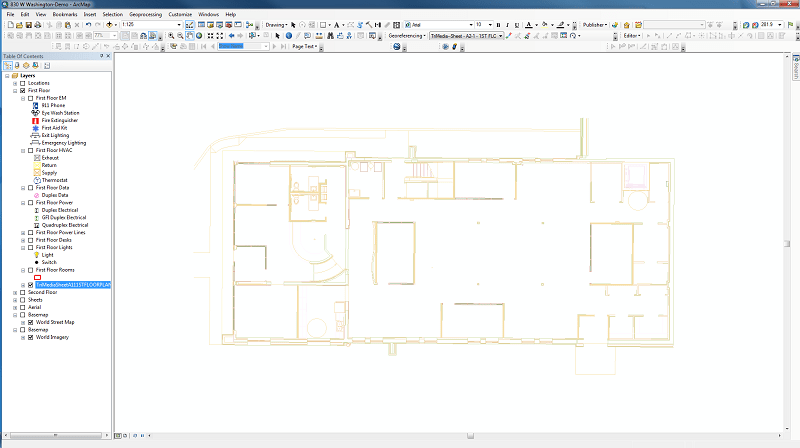
Above are the drawings from the first floor only. Layers can be toggled on and off (left sidebar) to make more elements come into or disappear view. This allows the user to view as much or as little information as they need.
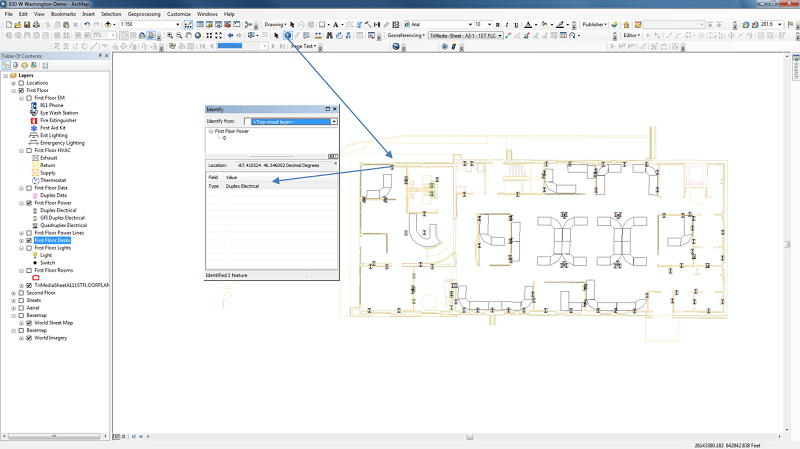
Using the GIS: The Identify Feature
The “identify” tool probably the most frequently used by GIS users. It is what pulls up all the information about a given asset.
What information is tied in with each asset is 100% custom. In our case, we added information fields based on table data provided by our architect.
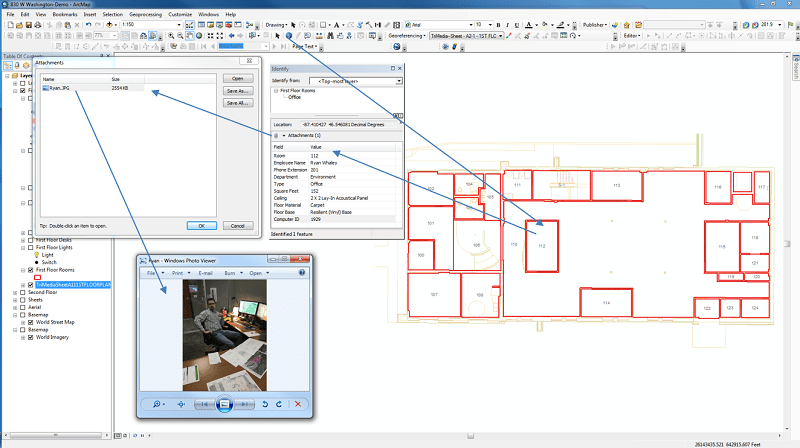
You can can tie file attachments to individual locations/assets as well.
For example, this office belongs to one of our Environmental Project Managers, Ryan. We added a picture of him into the GIS that can be pulled up using the “identify” tool. You can also see the room number and other applicable information.
[su_box title=”Further Application” box_color=”#638b18″ radius=”0″]Utilizing a “square footage” data field can be a big help when establishing/reviewing departmental budgets.[/su_box]
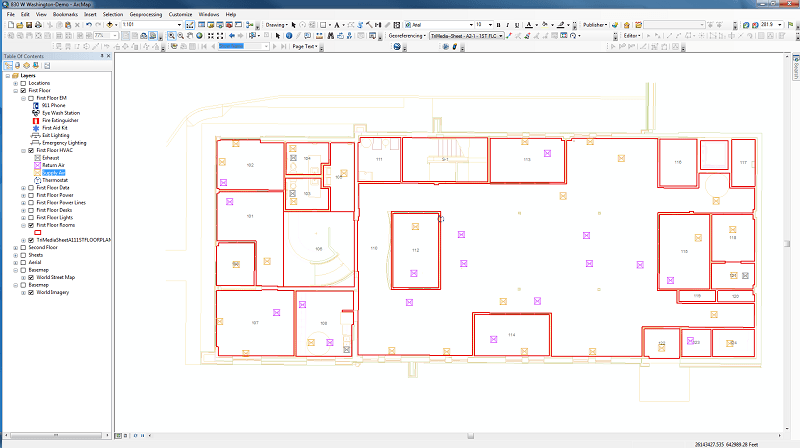
Using the GIS: Layers
After all the heavy lifting (data entry) was complete, we added more custom map layers we would find useful. For example, we wanted to see each office mapped out clearly. As you can see in the previous picture, we outlined them all in red. Those outlines all exist in its own layer.
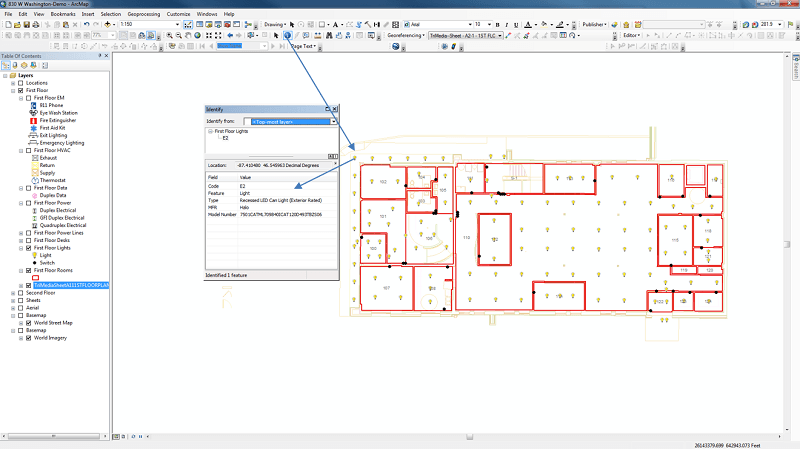
Since this was a complete demo/reno project, we wanted to map out all of our systems down to a granular level. Turning on another layer displays where all our lights, switches, and data ports are.
To give us a better visual representation of our office layouts and assist with inventory, we mapped out all of our desks. Here you see our desks and electrical outlets.
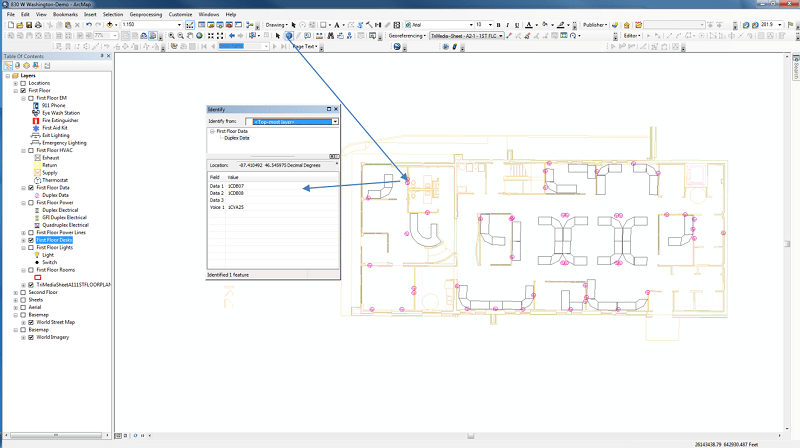
On another layer, you see our map of all our voice plugins, and data jacks – all information frequently requested by our IT department.
Another layer shows a simple illustration our HVAC system and thermostats.
[su_box title=”Further Application” box_color=”#638b18″ radius=”0″]Right now we have a physical copy of the user’s manual for our thermostat hanging above the control panel. With the GIS, we can find a PDF for the unit online and add it as an attachment viewable from the “identify” window. [/su_box]
Using the identify tool, you can see information about each and every element mapped out on each layer – right down to the serial number. Again, the information presented here can be as specific or as general as needed. For our usage, we need more specific information about our network than our HVAC system. This might be the complete opposite for more industrial settings.
[su_box title=”Quick Note” box_color=”#53585a” radius=”0″]In the above screenshot, light bulbs icons symbolize each light and pink outlines represent outlets. These symbols are completely customizable.[/su_box]
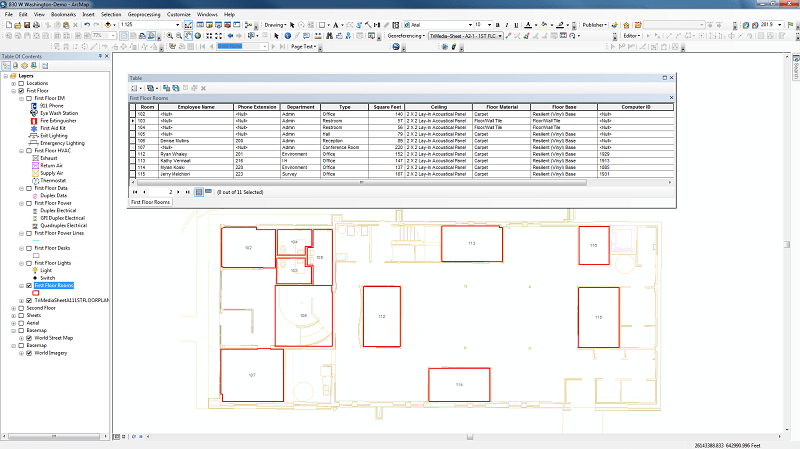
Where the Data Lives
Information for any GIS exists in tables only accessible from the back end. Anyone with the full version of ArcGIS can access the tables. When using the free ArcReader, tables will only be accessible by the folks running and maintaining the GIS.
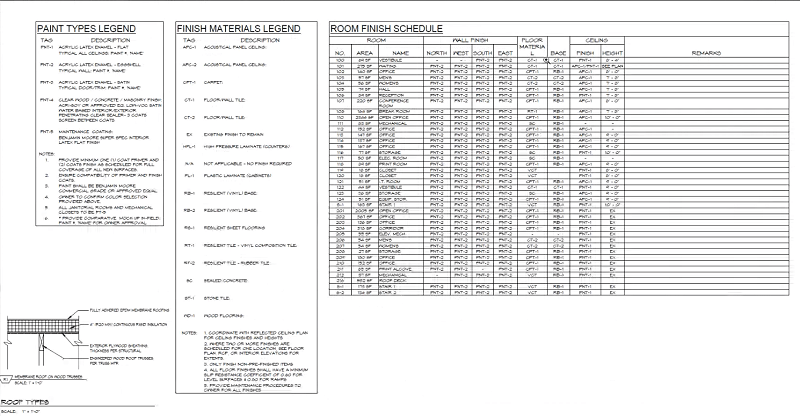
The table below shows the attributes offices that were queried (filtered) by a specific attribute. The results show up red on the map and are populated in the data table.
Our table of light bulb data includes fields for light type, manufacturer, serial number, wattage, etc. All the information shows up in the “identify” window the full and free versions of the GIS software. If fields are empty in the table on the back end, it will return “null” in the identify window.
Search Capability
Having the full version of the GIS software can be beneficial to run queries on table data. That said, any data that exists in the GIS is searchable in the the free version of the software. Going back to our light bulb example, if we get notice of a recall, we can simply search by that model number, and every instance of those bulbs would pop up in the GIS.
More Data Applications
What you can do with GIS is not limited to just mapping out your offices, light bulbs, and outlets. Below are some more uses we have found for the GIS – and we have only scratched the surface.
We mapped our power lines on each floor so we know which switch is linked to which overhead light.
We enhanced our emergency response plans with this map of our fire extinguishers, first aid kits, and eye wash stations.
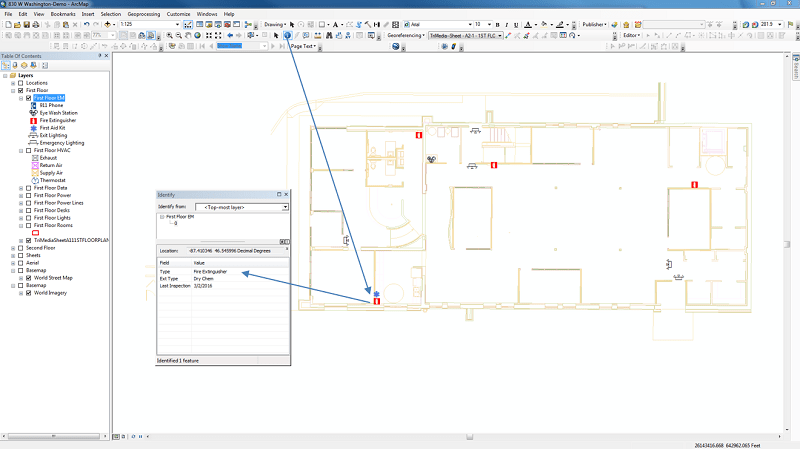
[su_box title=”Further Application” box_color=”#638b18″ radius=”0″]A “last inspection date” field can be added for each fire extinguisher. When the next one is due, an automatic email alert can be sent out as a reminder. [/su_box]
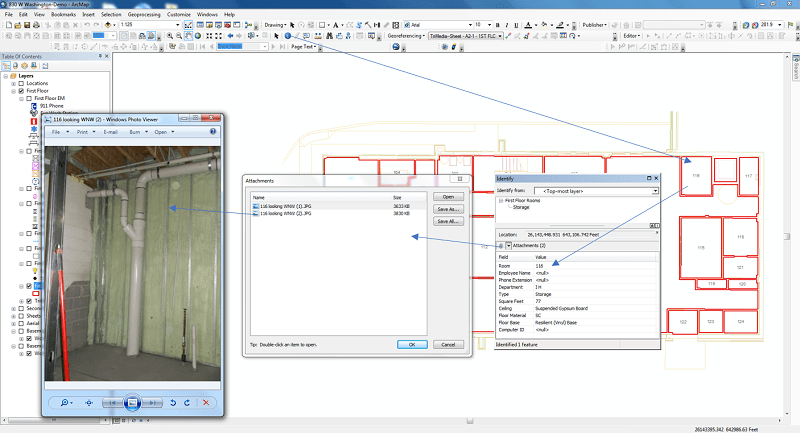
We also added photos of each wall cavity in each office for future reference.
Security cameras can also be mapped in the GIS. Simply embedding the link to a live feed in the initial data entry step allows locations to be monitored in real time.
The Bottom Line
The possibilities of a GIS are limited only by your own imagination. What we use it for may be very different from your own idea – but rarely is it impossible to input and visualize your unique set of data using a GIS. What would you use a GIS for? Let us know in the comments!